Conference
Misc

June 30 - July 3, 2015
Aalborg, Denmark
Invited Talks
We are excited to announce the invited speakers useR! 2015 in Aalborg! The line-up consists of Thomas Lumley (R Core, Survey), Adrian Baddeley (Spatstat), Steffen Lauritzen (gRaphical models), Di Cook (GGobi), Romain François (R/C++) and Susan Holmes (phyloseq).


Titles and abstracts
Click on title for abstract.
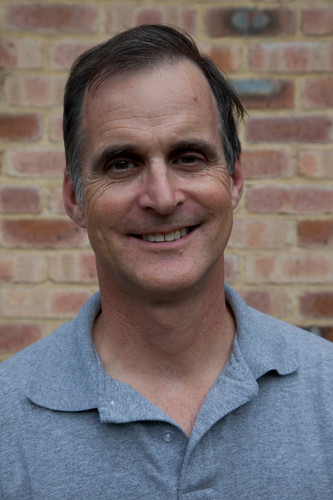
- Thomas Lumley: How flexible computing expands what an individual can do
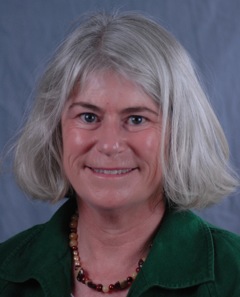
- Adrian Baddeley: How R has changed spatial statistics
- Steffen Lauritzen: Linear estimating equations for Gaussian graphical models with symmetry [slides]
- Di Cook: A Survey of Two Decades of Efforts to Build Interactive Graphics Capacity in R [slides / video download / video watch]
- Romain François: My R adventures
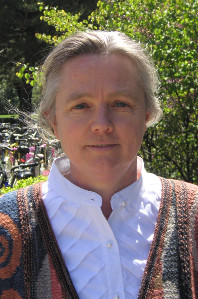
- Susan Holmes: Multitype data integration : challenges from the Human Microbiome
Thomas Lumley: How flexible computing expands what an individual can do
Friday July 3, 09:00 - 10:00, Aalborghallen, Chair: Peter Dalgaard
Design-based inference in survey statistics involves reimplementing everything to allow for unequal sampling probabilities and correlation in sampling, for moderately large data sets. Since there is only one way sampling can be iid, but many ways it can be unequal and correlated, there is a risk of reimplementing everything many times. I will talk about how the survey software in R has taken advantage of advanced concepts such as column-store databases and sparse matrices, and simple concepts such as objects. The result is arguably more comprehensive than any other design-based inference system available, but from at least an order of magnitude less effort.
Adrian Baddeley: How R has changed spatial statistics
Wednesday July 1, 15:00 - 16:00, Aalborghallen, Chair: Jesper Møller
The growth of R has triggered a revolution in the science of analysing spatial data -- especially its 'problem child', the analysis of spatial point patterns. I will sketch some of the revolutionary ideas (past, current and future) and demonstrate them using the contributed package 'spatstat', which played a prominent role in the transformation.
Steffen Lauritzen: Linear estimating equations for Gaussian graphical models with symmetry
Friday July 3, 12:30 - 13:30, Aalborghallen, Chairs: Søren Højsgaard and Poul Svante Eriksen
In models of high complexity, the computational burden involved in calculating the maximum likelihood estimator can be forbidding. Proper scoring rules such as the logarithmic score, the Brier score, and others, induce natural unbiased estimating equations that generally lead to consistent estimation of unknown parameters. The logarithmic score corresponds to maximum likelihood estimation whereas a score function introduced by Hyvärinen (2005) leads to linear estimation equations for exponential families, including Gaussian graphical models with symmetry.
We shall briefly review the facts about proper scoring rules and their associated divergences, entropy measures, and estimating equations, and show how Hyvärinen’s rule leads to simple estimating equations for Gaussian graphical models. Finally, it shall be discussed how these estimates can be used for fast model selection in Gaussian graphical models.
Di Cook: A Survey of Two Decades of Efforts to Build Interactive Graphics Capacity in R
Thursday July 2, 09:00 - 10:00, Aalborghallen, Chair: Adrian Baddeley
What's the difference between these two software descriptions?
Lisp-Stat is an extensible statistical computing environment for data analysis, statistical instruction and research, with an emphasis on providing a framework for exploring the use of dynamic graphical methods. Luke Tierney, 1998
R is a programming language and software environment for statistical computing and graphics. Wikipedia, Mar 2015
R has been eighty-seven steps forward for data analysis but twelve steps backwards for interactive graphics, from where XLispStat (and perhaps Data Desk) had put the field in the 1990s. In the intervening twenty years we have seen numerous contributions towards building the same capacity into R, with no absolute success as of yet. In this talk we will describe some of the key package developments, e.g. gwidgets, tcltk2, RGtk2, iplots, rggobi, rgl, SVGAnnotation, and the current exciting ventures, e.g. cranvas, animint, gridSVG, shiny, ggvis. Differences in how the attempts achieve interaction, that illustrate the strengths and weaknesses of the different approaches, will be discussed, with some emphasis on conceptual models for interactive graphics that support data analysis.
Romain François: My R adventures
Wednesday July 1, 09:00 - 10:00, Aalborghallen, Chair: Torben Tvedebrink
I will review my adventure with R, from the early days of getting used and addicted to the language and its community, my first attempts at participating in the community through mailing lists and the graphics gallery, valuable collaborations with other members of the community.
For some time now, my interests revolve around expressiveness and performance. The way R lazily evaluates expressions and allows for non standard evaluation has opened a few doors over the years, e.g. the rJava higher level syntax with J, to which I played a humble part, or lately the development of the vocabulary of dplyr. About performance, I’ve been spending significant time for a few years about the ease of which we can connect R with C++, the development of modern Rcpp has fed my need for both performance and expressiveness. The success of the Rcpp family of packages is a great testimony to efforts that were put in both these directions.
Each of these projects I’m involved with are not personal developments, but rather results of collaboration with relevant members of the community. I have learned a lot from these projects and hopefully shared some of my gained knowledge and expertise along the way.
Finally, I will tackle the exciting new avenues to explore. RcppParallel with its use of the Intel Thread Building Blocks library provides interesting means to approach parallelization with a compelling syntax and set of very approachable design patterns. I will give hints on how this is going to influence further developments in projects I’m mostly involved with, starting from dplyr, Rcpp11, Rcpp14.
Susan Holmes: Multitype data integration : challenges from the Human Microbiome
Thursday July 2, 15:00 - 16:00, Aalborghallen, Chair: Steffen Lauritzen
Using the flexibility of multicomponent objects, we have developed phyloseq: a Bioconductor package for joint analyses of phylogenetic trees, species contingency tables, community graphs and clinical data. I will show examples of reproducible research done on bacterial communities relevant for predicting preterm birth and resilience after perturbations using phyloseq together with standard ecological packages such as vegan and ade4. Finally, more recently we have developed Shiny-Phyloseq which runs as a browser application enabling biologists unfamiliar with R to analyze their microbiome data.
This is joint work with Joey McMurdie and Ben Callahan.
The execution of useR! 2015 would not have been possible without the strong commitment and generous support from our sponsors.
Diamond

Platinum


Gold


Silver


Bronze


Media